• Skip to main content
Compass

Lisa Finks|Lourdes Arencibia|Carolyn Duris

Compass
  • Start Here

    • Buying a Home on Chicago’s North ShoreThe North Shore buyer’s overview
    • Plan My Home SearchA short questionnaire to plan your search
    • The Insider’s Guide to the North ShoreThe towns, the housing and the process
    • North Shore Town QuizWhich North Shore town is your real estate soulmate?

    Find Homes

    • Coming Soon
    • Compass Private ExclusivesHow Compass private listings work
    • Search by Elementary School
    • Walk-to-Train

    Collections & Guides

    • New Construction Report + CollectionReport and current homes
    • Wilmette Lakefront Condo GuideCondo and co-op buildings on Sheridan Road

    Featured Guide

    North ShoreBuyer’s Guide

    The Insider’s Guide to the North Shore

    A buyer’s guide to the towns, the housing and the process.

    Get the Guide

  • Start Here

    • Selling a Home on Chicago’s North ShoreThe North Shore seller’s overview
    • Home ValuationFind out what your home is worth
    • North Shore Seller GuidePreparing your home to sell, room by room.

    Prepare & Position

    • Market Ready ConciergeThe current home-preparation program
    • Private ExclusivesA private-selling strategy, explained

    Seller Research

    • Best Time to Sell — North ShoreTown-by-town timing studies
    • Market InsightsLocal data and analysis

    Featured Resource

    North ShoreSeller Guide

    The North Shore Seller Guide

    Preparing your home to sell, room by room.

    Get the Guide

  • North Shore Communities

    All North Shore Communities

    • Wilmette
    • Winnetka
    • Kenilworth
    • Glencoe
    • Northfield
    • Glenview
    • Evanston
    • Northbrook

    Eight priority communities, not a boundary. Service extends throughout Chicago’s North Shore, the north suburbs, into the city and well beyond.

    Related Resources

    • North Shore Town Quiz
    • North Shore Schools & Attendance Boundary Guide
    • Search by Elementary School
    • Walk-to-Train
    • North Shore Preschool Guide

    Town Quiz

    Which North Shore Town Is Your Real Estate Soulmate?

    A short quiz for comparing the North Shore’s towns.

    Take the Quiz

  • Coming Soon
  • Market

    • Market Insights
    • Town Market Statistics
    • Best Time to Sell Studies

    Schools & Local Resources

    • North Shore Schools & Attendance Boundary Guide
    • North Shore Preschool Guide
    • Search by Elementary School
    • Walk-to-Train

    Guides

    • The Insider’s Guide to the North Shore
    • North Shore Seller Guide
    • Wilmette Lakefront Condo Guide
    • New Construction Report

    Stay Current

    • Monthly NewsletterThe North Shore, monthly.

    Subscribe

  • About

    • About Lisa, Lourdes & Carolyn

    Lisa, Lourdes & Carolyn

    • Lisa Finks
    • Lourdes Arencibia
    • Carolyn Duris

    Recognition

    • Recognition & Press

    Working Together

    Lisa Finks, Lourdes Arencibia and Carolyn Duris are independently licensed Compass agents who collaborate. Each represents her own clients.

  • Contact
  • Search Homes

Lisa Finks|Lourdes Arencibia|Carolyn Duris

Lisa Finks, Lourdes Arencibia and Carolyn Duris are independently licensed Compass agents who collaborate. Each represents her own clients.

Market Stats

When Do New Listings Come on the Market in Chicago’s North Shore

July 16, 2021 by Lisa Finks Leave a Comment

Wilmette New Listings by Month 2018-2021

Wilmette New Listings by Month 2018-2021

When Do New Listings Come on the Market in Chicago’s North Shore?

July 16, 2021

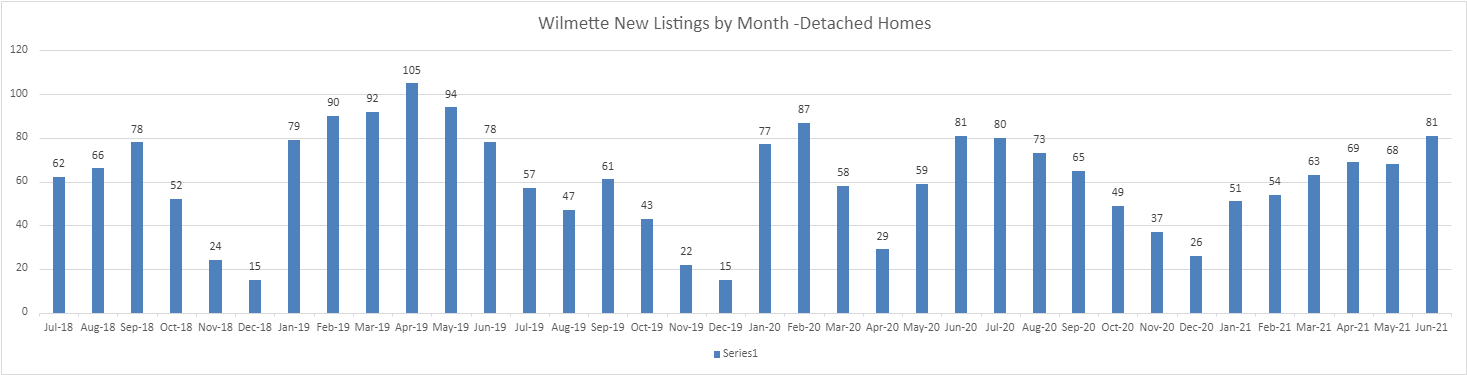
During this past week, two different buyers shopping in the Wilmette housing market have asked how many new listings they should expect to come on the market before the fall. These buyers were concerned it might be slim pickings until next spring. While my gut had a ready answer, I wanted to pull the data to understand the true picture as we often get this question.

The attached chart represents new Wilmette real estate listings, by month, from July 2018 through June 2021. As you can see, Wilmette buyers have historically seen a strong release of new listings through August and, in most years, even an uptick of listings in the month of September.  While 2020 had some unusual patterns due to the pandemic, the late summer/early fall numbers stayed strong.  We expect similar strength in new listings for August and September of 2021.

You may wonder what drives the timing of new listings in the late summer/early fall. Certainly, most sellers “know” the spring market has the most buyers and they target a spring list, but not everyone can pull that off.  Some sellers need to do work and that work gets delayed. Others prefer to spend a final summer in their home before downsizing. Still others, waiting on new construction, find their builder or rehabber is behind schedule. These are just a few of the reasons homes still go on the market in the late summer/early fall..

As a buyer seeking to find a fabulous Wilmette home in 2021, there should still be new inventory coming on this August and September, with an added bonus of less competition (since many buyers will have already committed to a housing situation for the next school year).

With historic limited inventory, you likely want to see every new home as soon as possible. If you’d like to get every new listing from every brokerage, both MLS and PLN (Coming Soon – private listing network homes) as soon as they hit the MLS, as well as the listings we learn about through our various networks, please reach out so we can set you up on a real-time search and put our networks to work for you!

Filed Under: Market Stats

Price Distribution in North Shore Chicago Real Estate

November 13, 2019 by Lisa Finks Leave a Comment

You’ve heard the old adage to never buy the most expensive home on the block, the same can hold true for your town as well!  Of course, sometimes you want that special home and can only get the yard you desire by purchasing at the upper end in a certain area (think Northfield and Glenview) so the purchase makes sense for you. Check out the price distribution charts for various North Shore towns and north side zip codes – see where your home fits in!


Price distribution North Shore and Chicago real estate

Price distribution North Shore and Chicago real estate

Filed Under: Home Values, Market Stats, Uncategorized

What’s Going On In The Winnetka Market? Four Charts Provide The Answer – Nov 2018

November 2, 2018 by Lisa Finks Leave a Comment

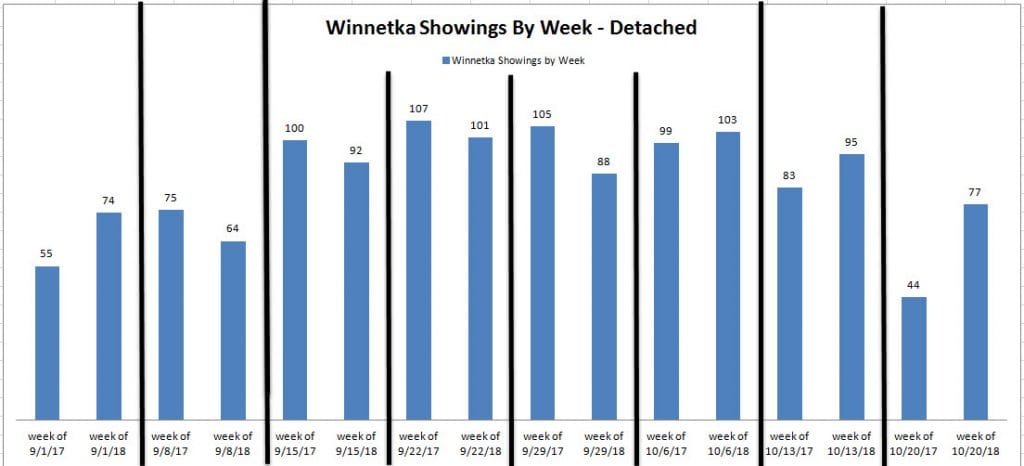
There has been a lot of talk about skittish buyers and drops in home sales in the Chicago area.  I was curious how that translated to the Winnetka market so analyzed the data and was surprised by what I found.

First, showing activity – the third quarter started out slower than 2017 but in the last few weeks, it has picked up and has pulled ahead of last year.  So buyers are out shopping and the pace is starting to pick up over last year.  That is good news.

Winnetka Showings By Week 3Q 2018

Winnetka Showings By Week 3Q 2018

Next, I looked at Under Contract activity.  After all, if buyers are looking but not buying – that doesn’t help the market at all. . . 
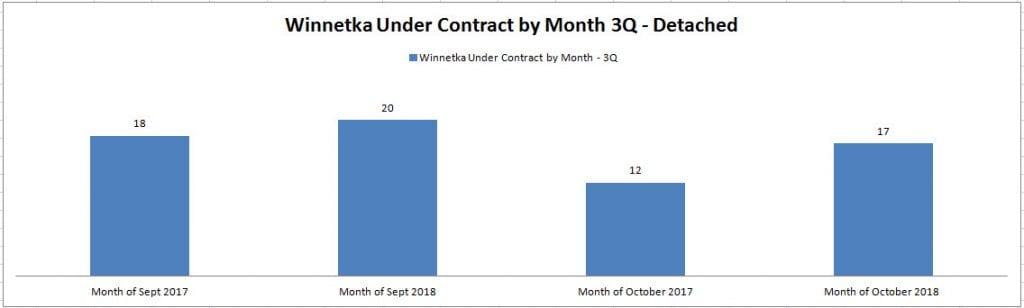
But under contract activity is up in Winnetka over 2017 levels, so buyers seem to be buying more Winnetka homes now that they did in the third quarter of last year.

Winnetka Under Contract3Q 2018

Winnetka Under Contract3Q 2018

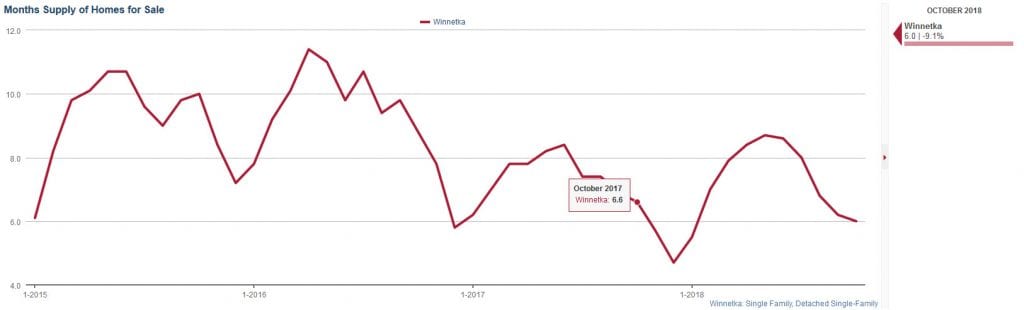
Showings and under contract activity seem to be edging past 2017 levels but it makes sense to check one last metric – inventory levels.  And those have decreased in 2018 v. 2017 so there are fewer homes on the market.  The months supply of home has decreased from 6.6 months a year ago to 6.0 months.  In raw numbers, 158 detached homes were for sale in Winnetka on 10/31/17 and 141 are on the market one year later.  So with slightly less inventory and increased buyer showing activity, prices are pushing up.

Winnetka Months Supply of Homes October 2018

Winnetka Months Supply of Homes October 2018

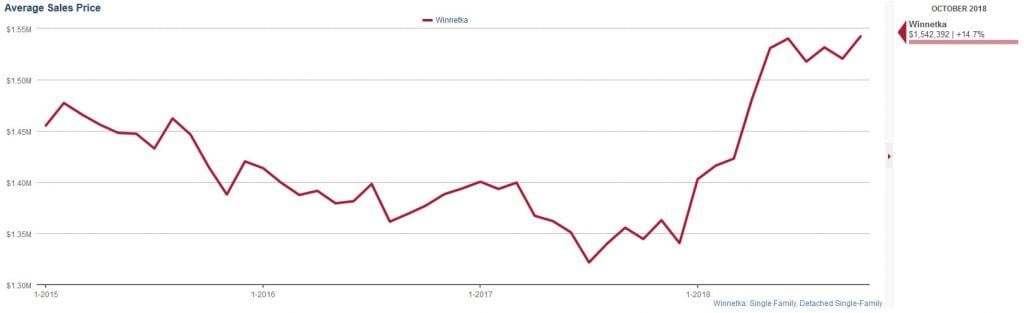
And average prices have pushed higher in Winnetka which is great news for sellers.

Winnetka Months Supply of Homes October 2018

Winnetka Months Supply of Homes October 2018

In sum, the Winnetka market is strong!  It’s still a great time to buy and sell!

For sellers, make sure your home is prepped to sell and priced competitively to contend with increased competition. 

For buyers, even though interest rates are rising, they are still at historically low levels and with a strong economy, it’s still a great time to invest in your future by purchasing a home.

Whether buying or selling, I’m happy to help.  Please call me at 847-778-0540 or email me at Lisa@LisaFinks.com.

For details about my exclusive Strategic Seller Program, click here.

For details about the comprehensive services offered to buyers, click here.

Filed Under: Market Stats

What’s Going On In The Wilmette Market? The Answer in 4 Charts – Oct 2018

October 27, 2018 by Lisa Finks Leave a Comment

There has been a lot of talk about skittish buyers and drops in home sales in the Chicago area.  I was curious how that translated to the Wilmette market so analyzed the data and was surprised by what I found.

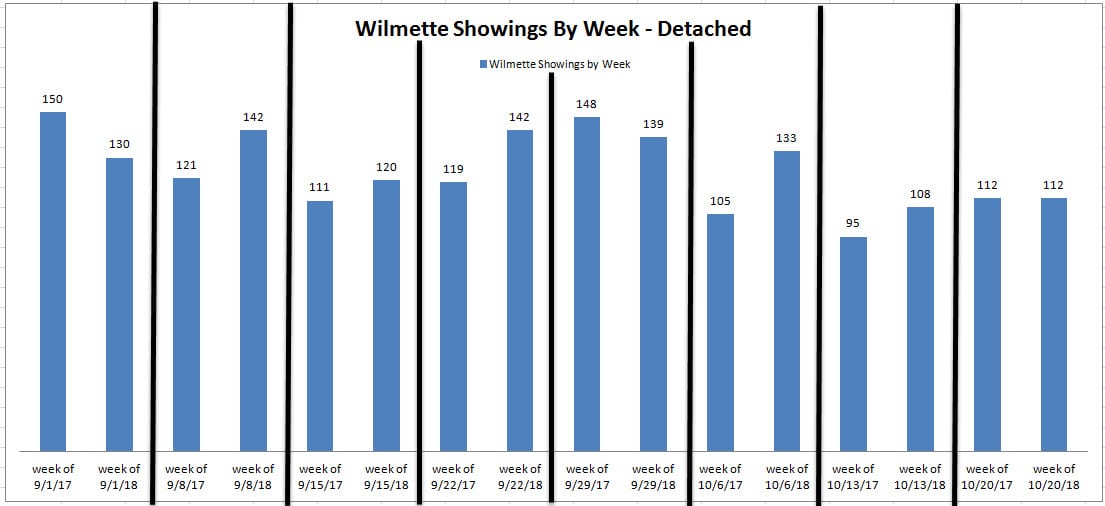
First, showing activity – it is essentially even with last year and, in some weeks, up over 2017 numbers.  So buyers are out shopping in equal numbers to one year ago!  That is good news.

Wilmette-showings-by-weekNext, I looked at Under Contract activity.  After all, if buyers are looking but not buying – that doesn’t help the market at all. . . 
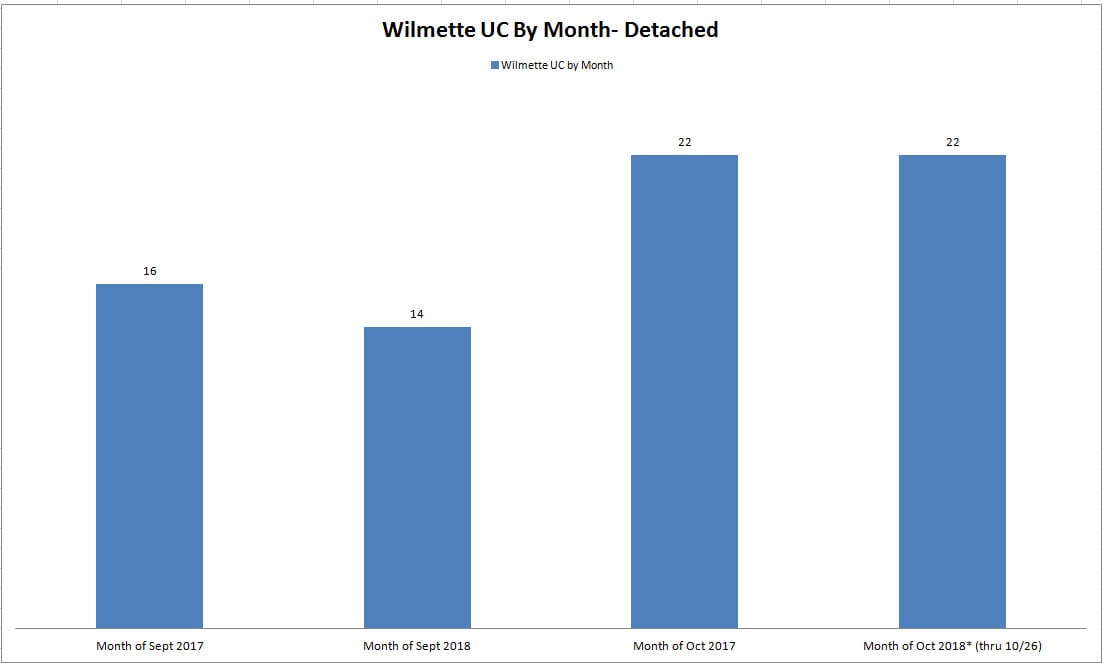
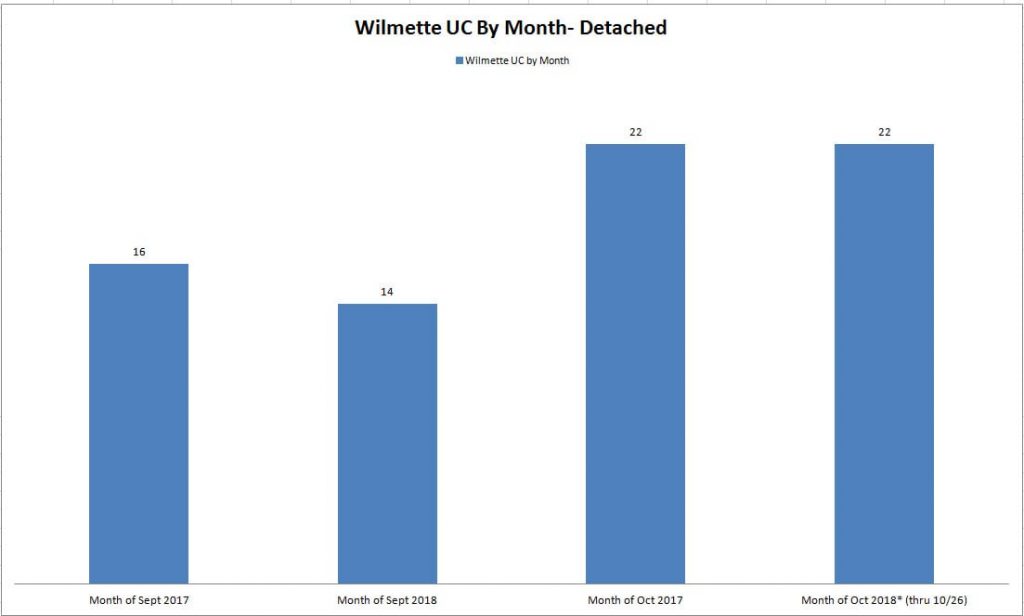
But under contract activity is also about even with 2017, so buyers seem to be buying as many Wilmette homes now as they did in the third quarter of last year.

Wilmette Under Contract Activity By Month

Wilmette Under Contract Activity By Month

 Wilmette Under Contract Activity By Month

Wilmette Under Contract Activity By Month

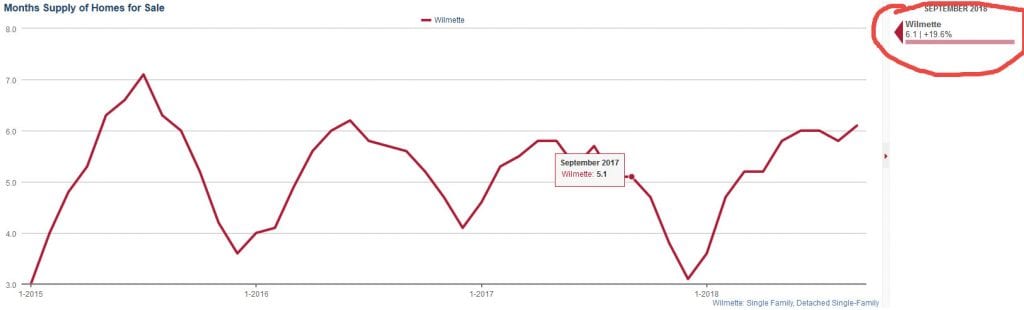
Since showings and under contract activity are just as strong in 2018 as in 2017, I wanted to check one last metric – inventory levels.  And those have risen in 2018 v. 2017 so there are more homes on the market.  The months supply of home has increased from 5.1 months a year ago to 6.1 months.  In raw numbers, 158 detached homes were for sale in Wilmette on 10/27/17 and 179 are on the market right now (10/27/18), one year later.  So with more inventory and stable showings/under contracts, it can feel like activity has slowed. . .

Months Supply Wilmette October 2018

Months Supply Wilmette October 2018

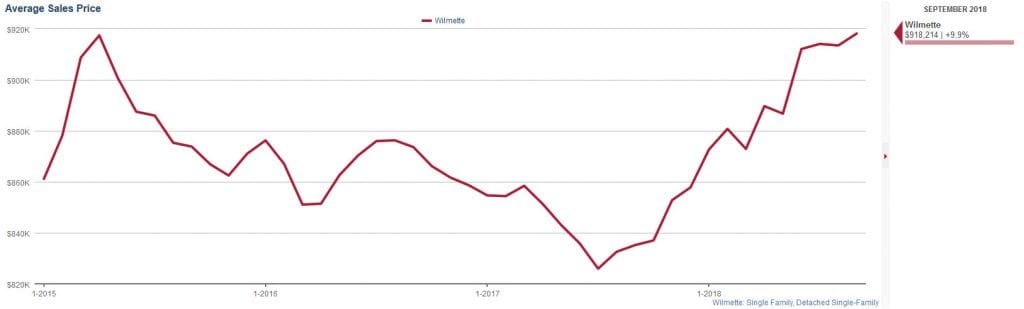
While a greater supply can lessen demand and push down price – there is more good news in that prices have held firm and have actually seen improvement in the last several months.

Wilmette Average Sales Prices October 2018

Wilmette Average Sales Prices October 2018

In sum, the Wilmette market is strong!  It’s still a great time to buy and sell!

For sellers, make sure your home is prepped to sell and priced competitively to contend with increased competition. 

For buyers, even though interest rates are rising, they are still at historically low levels and with a strong economy, it’s still a great time to invest in your future by purchasing a home.

Whether buying or selling, I’m happy to help.  Please call me at 847-778-0540 or email me at Lisa@LisaFinks.com.

For details about my exclusive Strategic Seller Program, click here.

For details about the comprehensive services offered to buyers, click here.

Filed Under: Market Stats

More Evidence that the tip-top of the home market is red hot

October 21, 2018 by Lisa Finks Leave a Comment

Filed Under: Market Stats

September Showing Activity

October 3, 2016 by Lisa Finks Leave a Comment

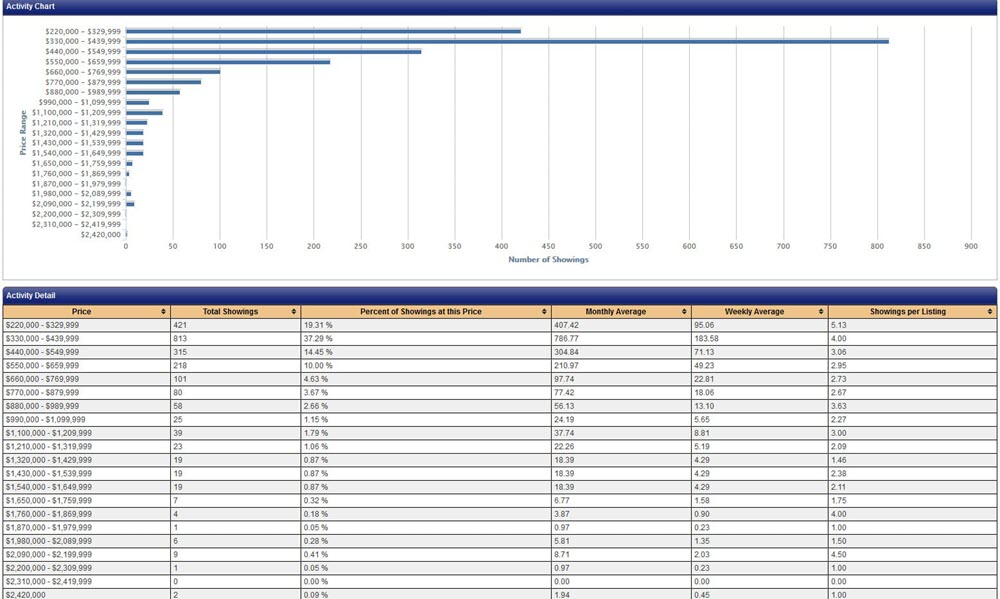
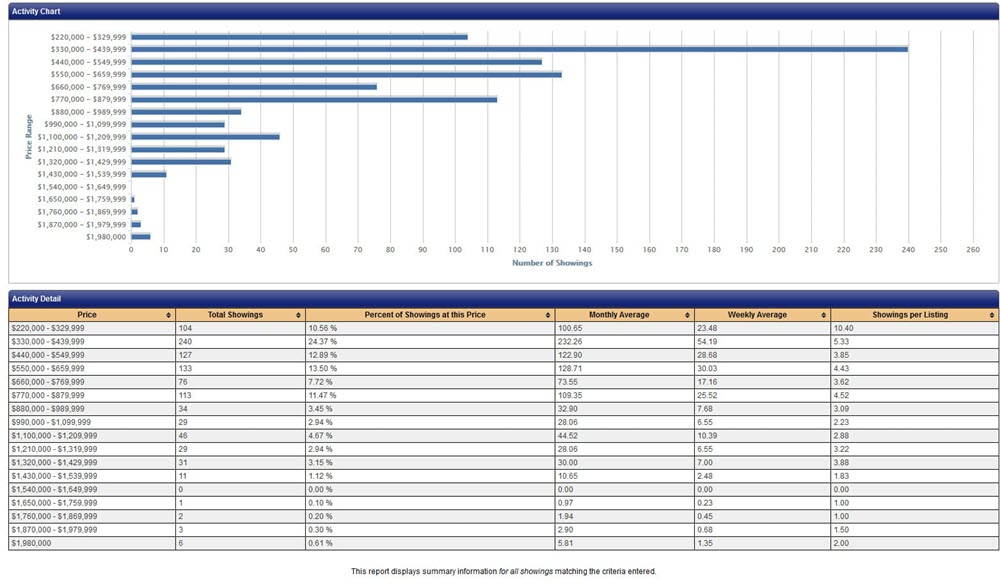
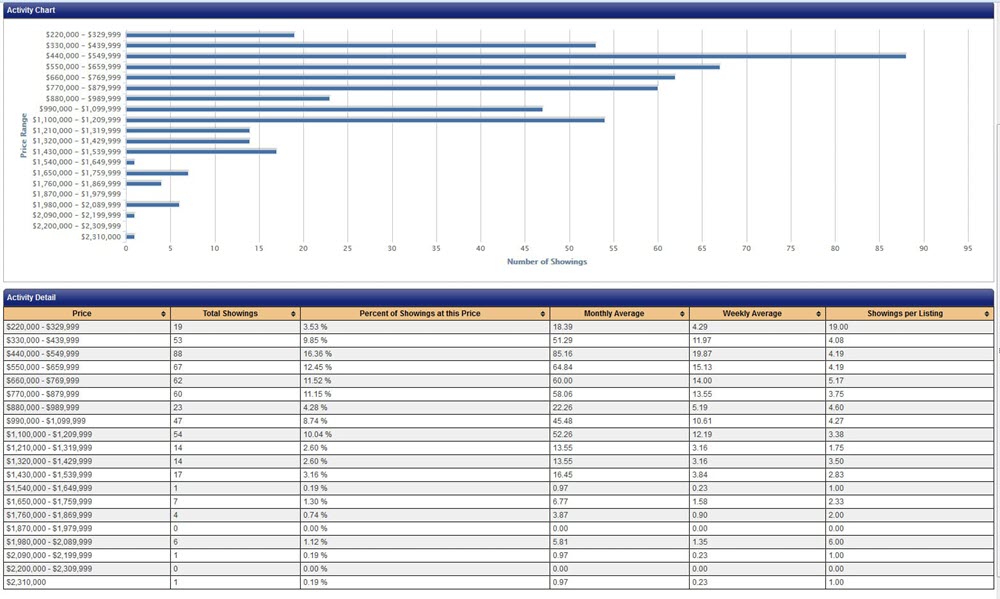
While the peak of the real estate market is generally the spring, fall often offers robust buyer activity as well – we call it the “September-October Bump”.  Below are a tally of the number of showings that occurred in various pricepoints from $300,000 to $2.5M for single family homes in Wilmette, Glenview and Chicago.

I suppose it comes as no surprise that the city would have highly concentrated activity in the entry level pricepoints, whereas Glenview and especially Wilmette, have a better distribution of activity across several different pricepoints.

It is important to note the final column in the lower chart which measures showings per listing as this takes into account the number of homes that are actually on the market in each pricepoint and gives you the truest picture of where the majority of activity lies.  For example, averages above 4 showings per listing indicate that it is a very popular pricing band. If you are in the market to buy, you should check out how competitive your price range will be to get an idea of how quickly you may need to move when you find that dream home!  For sellers, if you are between two pricepoints, you may want to opt for the pricepoint with more showings per listing as it will show the price band with the greatest demand.  Of course, if you need more details or data for another market area, please contact me, I’d be happy to run some numbers for you!

CHICAGO:

Chicago - SFH Showing Activity for September 2016

Chicago – SFH Showing Activity for September 2016


Glenview:

Glenview - SFH Showing Activity September 2016

Glenview – SFH Showing Activity September 2016

Wilmette:

Wilmette - SFH Showing Activity Sept 2016

Wilmette – SFH Showing Activity Sept 2016

Filed Under: Market Stats

The North Shore, monthly.
Market updates, community news and the occasional exclusive — about once a month, and never more than you'd want.
Join Our Monthly Newsletter

Compass
568 Lincoln Avenue
Winnetka, Illinois 60093
Lisa Finks
847.778.0540
Lisa@LisaFinks.com
Lourdes Arencibia
773.793.6220
lourdes@welcomehomenorthshore.com
Carolyn Duris
847.334.1600
carolyn.duris@compass.com
Buying Selling Coming Soon Communities Market Insights Contact

Lisa Finks, Lourdes Arencibia and Carolyn Duris are independently licensed Compass agents who collaborate. Each represents her own clients.

© 2026 Compass. Compass is a licensed real estate broker and abides by Equal Housing Opportunity laws. Licensing & Disclosures · Privacy Policy

All material presented herein is intended for informational purposes only. Information is compiled from sources deemed reliable but is subject to errors, omissions, changes in price, condition, sale, or withdrawal without notice. This is not intended to solicit property already listed.

Square footage, lot size, room counts, taxes and school assignment come from the MLS, from public records or from a third-party measurement service. Verify anything you intend to rely on.

Nothing herein shall be construed as legal, accounting or other professional advice outside the realm of real estate brokerage.